Investigation of invasive species in the repopulation of forests in New York City and New Jersey in the wake of the Chestnut Blight
Zeah Venitelli and Laura Venner
Plant Biology Laboratory, BC Bio 3241, Columbia University, Barnard
3009 Broadway, New York, NY 10027
lv2008@columbia.edu
Abstract
Invasive species are a problem in most disturbed habitats because they may eradicate a native species entirely leaving a niche open for another species to populate. In the event of this occurrence it is prudent to investigate the local impact upon the environment with regard to the eradication of the native species in order to determine the recovery and health of the environment. It is well documented that the fungus Cryphonectria parasitica, commonly known as Chestnut Blight, has caused the American chestnut to disappear from Northeastern deciduous forests. The Blight’s effects were first felt on American chestnuts in the Bronx Zoo in 1904 and continue to stymie the repopulation of the American chestnut in Northeastern deciduous forests. While invasive species tend to take advantage of disturbed areas, this study has shown that, for the Inwood, Lamont, and Stokes forests, located within New York and New Jersey, native species can establish themselves quite well in light of disturbance and eradication of former species by an invasive.
Introduction
The importance of reforestation after the eradication of the American chestnut was and is critical to maintaining healthy forest areas in the New York and New Jersey regions. The American chestnut, Castanea dentata, was a major force in the eastern United States, as is illustrated in the “Bulletin of the Torrey Botanical Club” figure below. The figure clearly identifies the wide distribution of the American chestnut during the early twentieth century. An invasive fungus known as Cryphonectria parasitic, and commonly known as Chestnut Blight, caused the American chestnuts to disappear from the Northeastern deciduous forests. The Blight’s effects were first felt on American chestnuts in the Bronx Zoo in 1904 where Chinese chestnuts, carrying this fungus and resistant to its damaging effects, had been imported to New York City. The airborne spores of the fungus quickly established themselves in the American chestnut stands that were not resistant to the blight killing all but the root systems of the American chestnut trees. The blight continues to stymie the repopulation of the American chestnut in Northeastern deciduous forests where it immediately attacks any American chestnuts that develop from the root systems which remain intact after the blight has devastated the shoot system.
According to the Stokes Forest Guide, “Prior to the early 1900’s, the American chestnut tree was an important member of the forest community. The nut provided food for both man and wildlife, the wood was strong, durable, and resistant to rot, and the tree itself had beautiful form. The wood from these trees was used extensively for fence rails, lumber, poles, and railroad ties” (13). The guide further states that “the subsequent escape of the disease led to a devastating epidemic and within twenty-five years the massive stands of American chestnut were wiped out” (13). Depicted below is the pre-blight range of the American Chestnut in the early twentieth century (Russell 184).
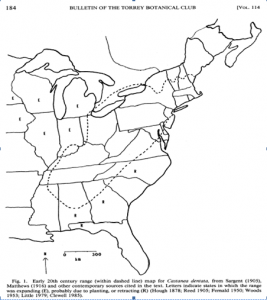
This experiment was undertaken to evaluate which trees and invasive species have succeeded the American chestnut in New York City and New Jersey forests as a result of the eradication of the American chestnut by the Blight. The forests studied in this investigation are as follows:
| Forest | Inwood Hill |
|---|---|
| Location | Upper Manhattan, NYC |
| Size | 196.4 Acres |
| Disturbance Level | High |
| Historical Prevalence of Chestnut in early 20th century |
1913: Other Upper Manhattan Parks (Fort Washington Park). Of 470 trees removed, 106 were American chestnuts. [1]
1915: 562 trees removed from all parks combined in Manhattan and Staten Island. [2] |
| Forest | Lamont |
|---|---|
| Location | Contiguous with the Palisades Interstate Park, Palisades NY |
| Size | 125 Acre estate contiguous with the 2500 Acres of wild Hudson river shoreline of the Palisade Interstate Park |
| Disturbance Level | Medium |
| Historical Prevalence of Chestnut in early 20th century |
“American chestnut, Castanea dentata. At the time of Hudson’s visit, this cousin of the oak was in all likelihood the dominant tree of the Palisades—as it was for much of the Eastern Seaboard. Much of the wood in the structures built by the New Deal agencies during the 1930s here in the Park was chestnut taken from the standing dead on the Palisades […] On the Palisades, a handful of adult chestnut trees still survive. A large specimen only succumbed in Greenbrook Sanctuary about five years ago”.[3] |
| Forest | Stokes |
|---|---|
| Location | Sussex County, NJ |
| Size | 15,996 Acres |
| Disturbance Level | Low |
| Historical Prevalence of Chestnut in early 20th century |
30% – 60% of the stand. [4] |
In each forest, the forest density, diversity, and types of native and invasive species were determined in an effort to identify which tree species have dominated forests in these regions in the absence of the American chestnut. Invasive species are non native human introduced species that opportunistically thrive in post disturbed areas and subsequently displace native species that would normally inhabit the niche. Because invasive species are so prevalent in disturbed regions, we hypothesize that invasives would dominate in these forests where the eradication of the American chestnut has created such disturbed niches.
Materials and Methods
(a) Forest Data collection
The point-quarter method was used to collect data from the Lamont, Stokes, and Inwood forest sites. In the Inwood Hill forest, the two transect sites were chosen from an area within the forest known as the Clove. The transects within this area were thus labeled as Clove #1 and Clove #2. At the Lamont Forest, two transect sites were chosen in a lowland area flanking a stream within a very wet and moist environment. These transects were labeled Lowland 1 and Lowland 2 based on their location Two transects were also conducted within a highland region bordering rocky cliffs in a substantially drier region of the forest, called Highland 1 and Highland 2. Within Stokes forest, two transect regions were also chosen in a lowland, moist environment next to a streambed located near the Stokes Forest Visitor Center. These were also designated Lowland 1 and 2. Two additional transect regions within Stokes forest were chosen from a highland area with a steep gradient located next to another streambed and dam near Kittle Road, designated Highland 1 and 2. Data for two transects was collected within the two designated sites at Inwood Hill forest, while data for four transects was collected within the designated sites at both Stokes and Lamont Forests. We began our survey at randomly chosen points within the regions that we selected for this study, and proceeded to evaluate the four nearest trees in a four quadrant area. After the initial data was collected a flag was placed at the originating point and we traveled a distance of ten meters to repeat the process. The process was repeated four additional times for a total of 50 meters before we returned to the originating transect point at station one. We collected data in several different locations of the forest to obtain a good sampling of the species diversity of the forest. All the trees were identified at the site utilizing May Theilgaard Watt’s Tree Finder, and the distances from the originating point in each sector to the center point of each tree were also recorded in meters. The method of data collection utilized is described in the Plant Biology Lab Manual (Callahan 2004) and data collection for this study was retrieved in strict accordance with the guidelines set forth therein.
(b) Data Organization
As with the data collection, the method for organizing the data retrieved from the forests can be found in the Plant Biology Lab Manual (Callahan, 2004). A species list was created that identified absence or presence of particular tree species in each forest. The information gathered was entered into a database by placing the number one in the cell next to the species name if the tree species was present or zero if the species was absent. From the data collected, we were able to calculate the diversity of species as well as the species richness. All field data was entered into an excel spreadsheet in order to calculate the species present in the forests and the number of consecutive occurrences of a given species, termed the run sequence, was also evaluated. This information enabled us to identify the species evenness for a particular area. After the species were entered and their runs identified, we calculated the Shannon-Weaver Diversity Index for each species. The Shannon-Weaver Diversity Index identifies, for each area, the changes in species richness and/or evenness. Upon completion of the calculations listed above, we proceeded to calculate the species density for each set of data. A further description of acquiring these calculations can be obtained from the Plant Biology Lab Manual (Callahan 2004). To determine the total species from all stations, we added the number of individuals of each species by area into an excel spreadsheet and obtained the total values per region of each tree species present.
(c) Background Research of American chestnuts
Historic data regarding the prevalence of American chestnuts in the Lamont, Stokes, and Inwood Hill forests prior to 1904 was obtained through consultation with the New York City Park Service Library, The New Jersey State Park Service, Palisade Interstate Park New Jersey Section, and the Stokes State Park Service. In addition, sources consulted include the New York City Park Service Annual Reports from 1901-1913, The Bulletin of the Torrey Botanical Club, and the Journal of Agricultural Research 1913-1949.
Results
Tree Species Observed
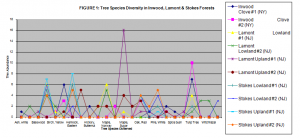
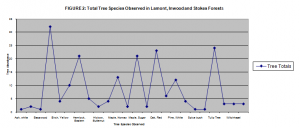
Identification and distance measurements were obtained for two hundred trees from the Lamont, Inwood, and Stokes forest sites. According to the data assembled in Figure 1, the Tulip Poplar has dominated the repopulation of Inwood forest while the Sugar Maple has dominated the Upland region of the Lamont forest with the invasive Norway Maple co-dominating the Lowland regions of Lamont forest along with the American Beech. Figure 1 also conveys the establishment of the American Beech in the Upland regions of Stokes forest with Eastern hemlock co-dominating the area. The lowland region of Stokes forest was dominated by the American Beech with co-dominance shared by the White Pine and Red Oak tree species. When all of the tree totals are combined per forest per species, see Figure 2, the trees that dominate in the forests in order of abundance, are the American Beech, Tulip Tree, Red Oak, Sugar Maple and Eastern Hemlock. However, it is noteworthy to mention that Eastern Hemlock was found only in Stokes Forest.
Tree Density Studies
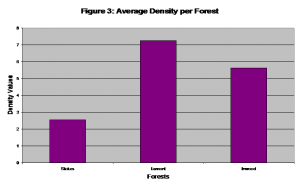
According to Figure 3, which demonstrates the average density per forest, the Lamont Forest has the highest calculated average density of 7.25656802. Inwood displayed a slightly lower average density of 5.62985233 while Stokes exhibited the lowest average density value of 2.54419024.
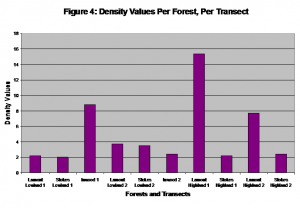
When the density of each forest is examined by individual transect, as seen in Figure 4, the Lamont Highland 1 transect exhibits the greatest density at 15.3787005. The Inwood 1 transect and the Lamont Highland 2 transect display similar density values to each other, with calculated density values of 8.818 for the Inwood 1 transect and 7.705 for the Lamont Highland 2 transect. Both Lamont Highland transects have much greater average densities than both Lamont Lowland transects, which demonstrates the varied characteristics of a single forest. All Stokes transects exhibit similar low densities when compared to the other forests. The transect with the greatest density in Stokes Forest is Lowland 2 with a density value of 3.5134. The Inwood transects show widely varied densities. Inwood 1 has a much greater density of 8.818 versus Inwood 2 which has a density value of 2.441. Both the Lamont Lowland 1 and Stokes Lowland 1 transects have similar calculated densities of 2.204 and 2.017 respectively. The Lamont Lowland 2 and Stokes Lowland 2 also have similar densities of 3.737 and 3.513 respectively.
Forest Diversity Studies
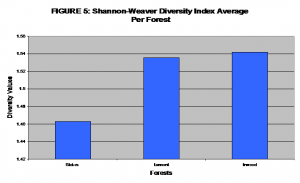
The diversity of each forest was calculated using the Shannon-Weaver Diversity Index. According to Figure 5, which displays the average Shannon-Weaver Diversity Index per forest, the Inwood Forest had the greatest average diversity index calculated at 1.542024. The Lamont forest displays a similar calculated average density index value of 1.535761 while Stokes Forest has the lowest calculated average diversity index value of all three forests at 1.463022. This indicates that of all three forests, Inwood exhibits the least average amount of species evenness while Stokes Forest exhibits the highest average amount of species evenness.
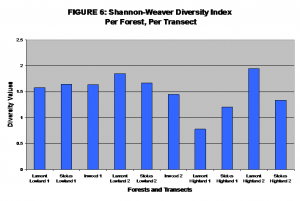
When the Shannon-Weaver index for each transect in each forest is examined, Lamont Highland 2 displayed the highest index of 1.9433. However, Lamont Highland 1 displayed the lowest index value of 0.7776 for all forest transects studied. Both Lamont Lowland transects have similar diversity indices with Lamont Lowland 1 having an index value of 1.574 and Lamont Lowland 2 having an index value of 1.8479. All Stokes transects have relatively similar Shannon-Weaver Diversity indices with both Highland transects having only slightly lower indices than the Lowland transects. Stokes Lowland 2 has the largest index of the four Stokes transects with a calculated value of 1.6695. Of the transects within Inwood forest, Inwood 1 shows a slightly higher diversity index than Inwood 2 which are 1.6385 and 1.4455 respectively. Interestingly, the Stokes Lowland 1, Lamont Lowland 1 and Inwood 1 transects all display similar indices. The Stokes Lowland 1 index is calculated at 1.6399, Lamont Lowland 1 index is 1.6695, while Inwood 1 has an index of 1.6385.
Jaccard Forest Similarity Study
According to the results of the Jaccard similarity index calculated for all three forests, see Figure 7, all the forests display very low similarity indices to each other, the lowest being between Lamont and Stokes Forests with a similarity index of 0.20. The two forests exhibiting the greatest similarity are Inwood and Lamont forests which display a similarity index of 0.28. These results indicate that each forest is incredibly dissimilar.
Discussion
According to our results, and contrary to our hypothesis, it appears that native species have repopulated the forests in the absence of the American chestnut instead of invasive species which was the basis of our hypothesis. In Inwood Hill Forest, located within New York City, the predominant species that have repopulated the forest are Black Cherry and Tulip Tree. It appears from our data that Inwood Hill is a relatively dense and diverse forest with numerous tree species many of them natives. This was very surprising as the region is highly disturbed and, therefore, a region that would be ideal for the explosion of invasives. The number of native species in this forest may have to do with the recent reforestation efforts. According to the New York City Department of Parks and Recreation, “Over 2.5 acres of forest were completely restored by removing invasive, nonnative shrubs and vines and replanted with native vegetation” (Benepe). In light of this information, it is unclear whether invasive species would have established themselves or not in the Inwood Hill Forest region as invasives were aggressively eradicated by humans when they were discovered. This may have a significant effect on our data concerning the nature of repopulation because of human efforts to ensure the repopulation of the Inwood Hill Forest with native species.
It appears that coniferous, hardwoods, and other tree species such as the Oak tree, White Pines, American Beech and Eastern Hemlocks have filled the niches left behind by the eradication of the American chestnut by the Chestnut blight in Stokes Forest. From our data, it appears that the Stokes Forest transects are not as dense as those of the other forests in our study and has greater species evenness than both the Inwood and Lamont Forests. This may be because Stokes Forest is a site that has had minimal human disturbance and therefore has minimal invasive species. However, there have been some minimal improvement cuttings in the past. Specifically sited in the 1927 Journal of Agricultural Research, Korstian and Stickel mention that Chestnut “stands are obviously in need of an improvement cutting aimed especially at increasing the proportion of desirable species, which was reduced about 20 years ago by a cutting that culled out most of the best pitch pine” (644). However these controlled cuttings were restricted to three small plots within the entirety of Stokes Forest.
Even though Stokes Forest seems to be replacing the Chestnut with native species, it is not immune to undesirable species. Korstian and Stickel also mention in their 1927 report that,
“Although the chestnut is being replaced naturally for the most part by tree species, yet the presence of a relatively high proportion of undesirable species introduces important problems in connection with subsequent thinnings and improvement cuttings […] the proportion of desirable species is rather deficient because of the heavy cover of the mountain laurel (Kalmia latifolia) and scrub oak. These undesirable species will in time be shaded out by the tree species, the scrub oak being the first to give way” (645).
This information regarding Stokes Forest, along with our own collected transect data, provides a unique historical perspective of forest transformation in the past century due to the Chestnut blight. This information shows how a forest will naturally repopulate itself and, in the case of the undesirable mountain laurel and scrub oak, the Forest will take care of the undesirable species through superior vigor of desirable ones, such as hardwoods, which eventually shade out the undesirable species. Undesirable species however, are not invasive species, and the lack of invasive species in Stokes could be attributable to the lack of widespread human disturbance. The authors also mention, “Although the pine is here somewhat more aggressive as a replacement species, particularly in filling in larger openings left by the death of the chestnut, many of the pine seedlings are lacking in vigor and will probably be overtopped by the hardwoods” (645). Although we found that the White Pine and Eastern Hemlock were predominant species in Stokes we also found that the American Beech is also a dominant tree in this forest and studies of the leaf litter in all four transects indicate many different hardwoods are present within Stokes Forest. Among the leaf litter were the following species: Red, White and Chestnut Oak. The leaf litter also included several non-hardwood species such as the Tulip Tree, Yellow Birch, Sugar Maple, Quaking Aspen, and Hickory. This indicates that through time Stokes Forests eventually filled the niches left by the absence of the American chestnut with native and vigorous species in undisturbed environments.
In the Lamont forest lowland transects, the Norway Maple, an invasive species was co-dominant with the native American Beech suggesting that in this lowland region, invasive species are taking root. Our transect data indicates that it is also a relatively dense and diverse forest, and because Lamont Forest is contiguous with the Palisade Interstate Park, which borders the Palisades Parkway, this region is an area of extremely high human disturbance. This high disturbance may explain the reason why the invasive Norway Maple has been able to establish itself so well. However, the less disturbed highland region of the Lamont site had a predominance of the native Sugar Maple. Because there is a chance that there has been high disturbance in the Lowland regions due to their location near the palisades, the opportunistic invasive Norway Maple had a better chance to secure its establishment. It is interesting to note, from our data, that two different species of Maple have become dominant in two different regions of this forest. This may be due to favorable conditions for this species in this forest. The dominance of the Sugar Maple in the Highland region of Lamont may be attributed to fire suppression in the area causing the Sugar Maple to establish itself and dominate this region of forest. The USDA expresses that Sugar Maple does well in highland areas which would account for the abundant presence of the species in the Lamont Highland 1 region but does not adequately explain why it may be lacking in the Lamont Highland 2 region of the forest. A possible explanation for this discrepancy may be that the species established itself initially in the Lamont Highland 1 region and is currently spreading through the rest of the forest. Also, Sugar Maples are intolerant of air pollution and are susceptible to stem and root injury which may account for the lack of abundance in the Lamont Highland 2 region of the forest.
In conclusion, we have uncovered that invasive species are not always the predominant species of disturbed areas. The species repopulation of the forests examined depended on several factors including environmental conditions and human disturbance. When human disturbance was high, invasives were able to establish themselves vigorously except in the cases where humans intentionally removed the invasives from the forests. However, when the forests were left to their own devices it appears that the native species were able to repopulate the area and outcompete any undesirable that may have tried to establish themselves. It also appears that species evenness and richness may also depend on the species of tree present and the level of human disturbance in the forest. The forest with the most human disturbance appears to have a greater number of species as in the case of the Inwood and Lamont forests. From our study of these three forests in New York and New Jersey we have concluded that native species have replaced the American chestnut, in certain forest regions, which were eradicated in the Northeastern deciduous forest due to the Chestnut blight.
Acknowledgements
We would like to acknowledge and extend our appreciation to Julia and Dr. Callahan for their support and help in the field as well as in analyzing, organizing, and contributing to the data included in this report. We would also like to extend our appreciation to the helpful park rangers and park librarians who graciously helped us obtain historical data on these parks.
References
Benepe, Adrian. Manhattan Resources Site. Northern Manhattan Parks Forest Restoration: Project Goals. New York City Department of Parks and Recreation. 07 Dec. 2004.
Dickerson, John. 2002. Tulip Poplar. USDA NRCS New York State Office, Plant Fact Sheet.
Korstian, C.F. and P.W. Stickel. 1927. The natural replacement of the blight killed chestnut in hardwood forests of the northeast. J. Agr. Res. 34:631-648.
Nesom, Guy. 2003. Sugar Maple. USDA, NRCS, National Plant Data Center & the Biota of North America Program.
New York City Department of Park & Recreation, Natural Resources Group. Manhattan Restoration Sites, Northern Manhattan Parks Forest Restoration Project Sites: Inwood Hill Park. 2000-2003.
Palisades Interstate Park-NJ Section. “Requiem for a Nut.” 1998.
Ronderos, Ana 2000. Where giants once stood. Journal of Forestry. Bethesda: Feb 2000. Vol. 98, Iss.2; pg.10, 2.
Russel, Emily W.B. 1987. Pre-blight distribution of Castanea dentate (Marsh.) Borkh. Bulletin of the Torrey Botanical Club, 114(2): 183-190.
The State of New Jersey Department of Environmental Protection Division of Parks and Forestry State Park Service. A Guide to Stokes Forest. State of New Jersey Department of Environmental Protection, reprinted 2003 of the original Guide as it appeared in 1980.
Watts, May Theilgaard. Tree Finder: A Manual for the Identification of Trees by Their leaves. Rochester, NY: Nature Study Guild Publishers, 1998.
Figures
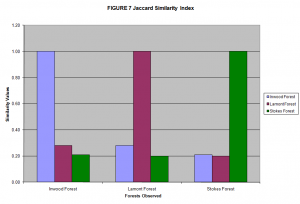
This index displays the similarity between forests. A value of 1 for each forest is the comparison of the forest to itself showing the highest similarity result. A similarity value of 0 would indicate that two forests display no similarity at all. From these results it is apparent that when Inwood forest is compared to Lamont and Stokes Forests few similarities are witnessed. The same results are seen across the graph when the forests are systematically compared to each other. The forests show very little similarity to each other.
Footnotes
[1] New York City Park Service Annual Report – 1913 page: 46
[2] New York City Park Service Annual Report – 1915 page:97
[3] “Requiem for a Nut” Palisades Interstate Park Commission, NJ Section, Copyright 1998
[4] Korstian, C.F. and P.W. Stickel. 1927. The natural replacement of the blight killed chestnut in hardwood forests of the northeast. J. Agr. Res. 34:631-648.
